Predictive Churn Indicator


Not all revenue is equal. Figuring out how strong yours is remains key for the future of your business, especially in a post-covid world and the likely crisis.
When facing troubles, most entrepreneurs (me included) have a tendency to apply a macro risk and global hypotheses to their business. For example, they will assume “overall revenues down 20% vs budgeted for next 6 months.” However, the latter does not make sense and ignores basic assumptions that could put your business at serious cash flow risk. Each client must be quickly analyzed.
At Newfund, we have developed just that: a practical tool to analyze the strength of revenues streams for any B2B startups. It takes 15 minutes and any early-stage company can (and should do it). You can find it HERE and you’ll find a tutorial on how to use the tool at the end of the article.
1️⃣ The methodology behind the tool
The methodology is straightforward.
We start from one core assumption: people will get rid of everything that is not a must have, and some sectors are more severely impacted than others by the crisis (pretty obvious for a starting point, isn’t it?).
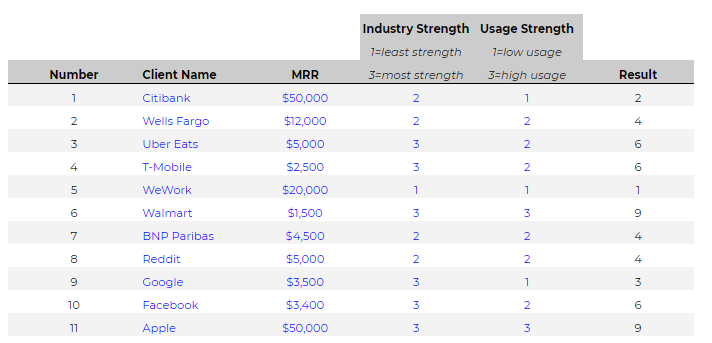
The first step is rating each client (or the top 30 if you got many) from 1 (low) to 3 (high) in these two categories : 1) strength of industry and 2) strength of usage. The multiplication of the two ratings gives us a score between 1 and 9.

As you input the results for each client, you will have corresponding scores:
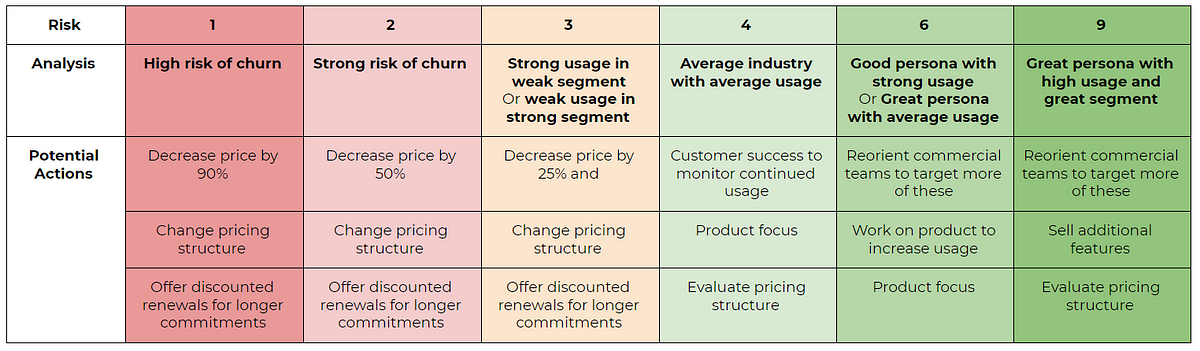
But what do those scores even mean? Here are the rough implications of each score (and why you should take this analysis seriously):
- 1/2/3: These clients have at least one strength factor of 1. They’re in a bad industry or they are not using your product. Therefore you need to avoid that they churn because they will be hard to sign in the future even when things get better.
- 4/6: These clients are either average or only have one strong strength factor. Therefore You need to ensure they continue paying. Focus should be on customer success or work on the product.
- 9: These clients are the least at risk. You should focus on upsell with them or reorient your commercial teams towards more of those.
Simple enough, now what?
2️⃣ Acting on the results
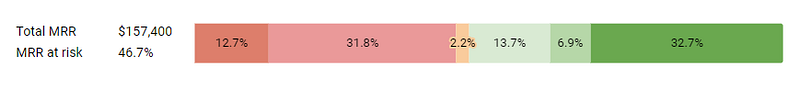
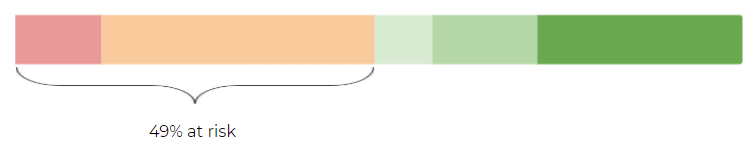
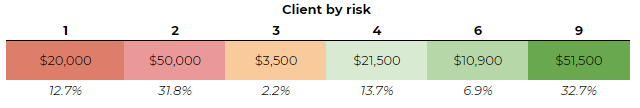
Analysis without action is meaningless. That’s why the tool outputs cigarette graphs with meaningful information to help you decide on next steps. They look like this:
Once you have your dynamic cigarette, you should analyze what it means and how you can act on the results. Here are just a few ideas among many others:
Hence, ask yourself based on your cigarettes, should you change pricing, work on your product, or adjust spending? Should you protect your book & prepare for some spending cuts or your book is protected enough that you can increase spending to win more?
The tool is simple and powerful. Jonathan Livescault of Braineet adds a financial layer to the exercise and calculate the resulting EBIT based on each different actions he would take. But below are two examples of how two Newfund startups use the tool to improve operations.
3️⃣ Two case studies
- Data Galaxy

Data Galaxy is a B2B data mapping SaaS. Their customers use Data Galaxy as a collaborative tool to better understand and value their data. It helps experts and business users build a comprehensive and exhaustive vision of their data environment in order to address regulatory and productivity issues.
Their customers are both Enterprises and SMBs. They are mostly engaged for 1 to 3 years, with good retention and upsell rates. However, with the threat of Covid-19, Data Galaxy expected a higher risk of churn because of macroeconomic uncertainties. To assess this risk they applied the cigarette analysis and here are the results and lessons learned:

They noticed that a significant part of their MRR was at low risk (6 to 9), meaning that their MRR could be considered as quite strong despite this difficult period. Around 32% of their MRR was more exposed (2 to 3), represented mostly by new customers (low usage) or pending renew customers (higher risk or churn).
This analysis has emphasized that Data Galaxy can rely on a strong customer base in insurance, representing 65% of their MRR, with a low sector risk and a high usage maturity in data management. This methodology especially helped Data Galaxy to identify where to prioritize their CSM action plan to address most risky customers. Data Galaxy also decided to apply the same methodology to review their marketing plan targeting new customers as well.
2. Agora Place

Agora Place is a B2B marketplace for electronics where professional buyers and sellers trade reconditioned products at scale on a daily basis. Many buyers are retail businesses which in turn sell to end-consumers. Many sellers are logisticians, repair warehouses, or official distributors.
The service is extremely sticky with cohorts at 200% (percentage of MRR retained relative to starting month) even after 3 years of usage for both buyers and sellers. During the coronavirus crisis, a lot of the buyers closed. The team, in a bid to help the latter and prepare them for a post-covid business model assessed where its MRR came from. It found that most of its clients had results 3 and 9:
Dividing their personas in two, they evolved the product two-pronged. To address the clients in 3 (with strong usage but an industry at risk), they launched two initiatives:
- Dropshipping: As such, retail stores can sell to their own clients inventory they do not own and therefore remain open even with potential lower foot traffic from coronavirus health measures.
- A Tech API: to integrate all stock available on Agora.place, the company developed an API so that clients can sell on their Facebook or Shopify stores in two clicks.
To address the clients in 9: they re-organized their sales team to target more of the latter in a post-covid world.
Last week they re-assessed their cigarette and it now looks like this:
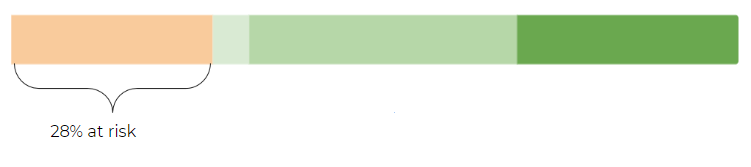
Using this method, the company evolved their business model and product focus in a time of crisis. Pricing wasn’t so much a challenge in their case as they do not charge fixed monthly fees.
4️⃣ Tutorial
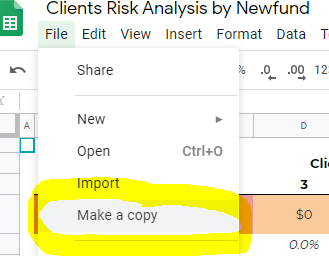
- First open the document available here and make a copy
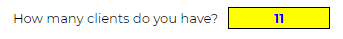
2. Start with indicating how many paying clients you currently have:
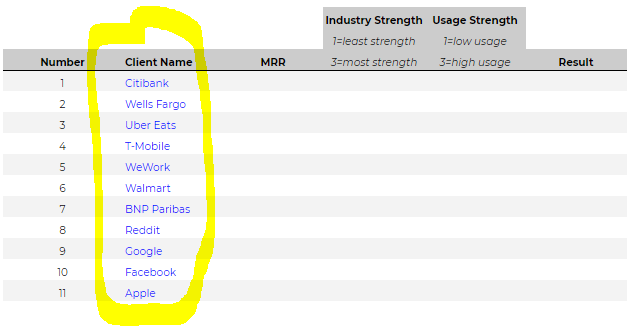
3. Then write down the names of these clients:
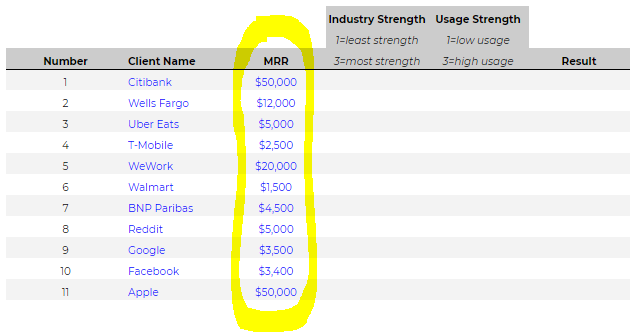
4. For each client, input the associated MRR/revenues:
5. Then rate the industry or category in which the client operates from 1 to 3. Below is an illustrative chart of industries to determine a simple strength factor.
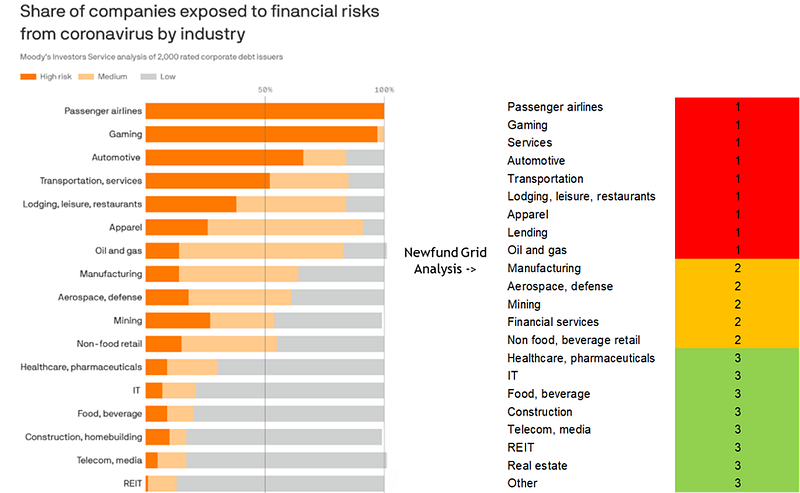
1 is for industries with the least strength. For example, movie theaters. 3 are forindustries with the most strength. For example, film streaming solutions.
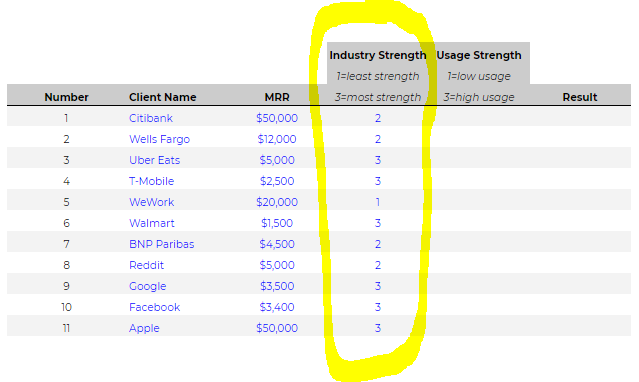
Once you have made your mind, input that number in the next column:
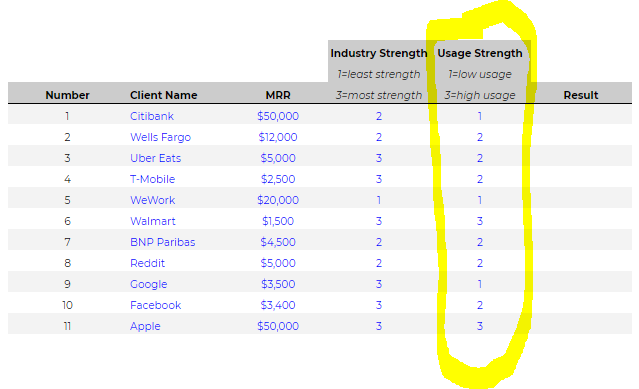
6. Finally apply a usage strength based on how much the client uses your service. If you charge a monthly fee, focus on recent usage. If your customers sign for 1 year or more, you can adjust observed usage by a factor linked to the term of the contract. Obviously stay as objective as possible:
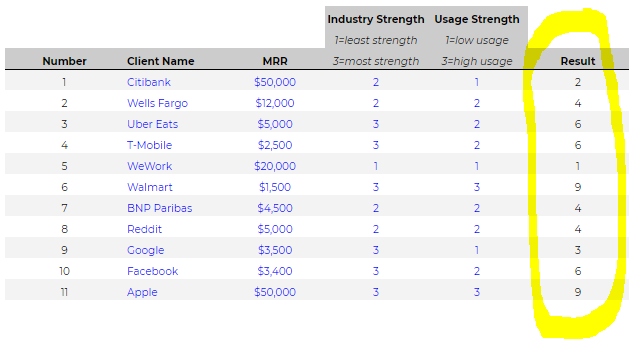
7. Once completed, you will obtain each client’s overall strength result:
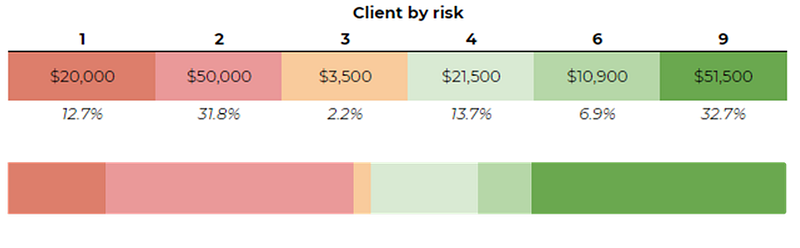
The module will spit out your two unique cigarettes:
The static one:
And the dynamic one:

Obviously this cigarette analysis can be and will be refined, but it’s a first step you must go through.
If you have questions, comments, and even feedback about the exercise, feel free to ping me. Finally, I would like to thank everyone who has helped me write (or has advised me) for this story; from Gonzalo Sánchez (Seedcamp), Clement Vouillon (MemoHub), Jonathan Livescault (Braineet), Lazhar Sellami (DataGalaxy) to Tanguy Pennel (Agora Place).
You can find some of their Twitter handles below:
🐦 Gonz Sanchez: @gonsanchezs
🐦 Clément Vouillon: @clemnt
🐦 Jonathan Livescault: @JLivescault
Your feedback is priceless, feel free to ping us at francois@newfundcap.com.